Tech news 4: Reporting your figures and model results in your manuscript
This month the audience is increasing, besides the Biodiversity Synthesis group, the iCode Coding Club mailing list will receive this email (and the next).
Today’s email will include tips and ideas on streamlining figure inclusion and reporting model results in manuscripts. Since practices in the team and the institute vary a lot, I’ll give information for different levels, mostly for colleagues who use copy-pasting / hand-typing but latex/rmarkdown/quarto users might also learn something useful (or teach me something in return :D).
Reporting figures
Here, I essentially recommend not to ever copy-paste:
- Always save your figures using the appropriate function, ggsave, pdf, png, jpg, etc. This is the better move for a streamlined and reproducible workflow. I like using a vectorised format such as SVG, finally supported by Apple Pages and Keynote, as it is lightweight and have no resolution problem but journals often don’t want them?
- Then from your Word or Powerpoint document, Insert, Pictures, Picture from file, select your file and select the options “Link to File” and “Save with Document” and Insert. Thanks to these options, every time your R script updates the figure file on your disk, Word or Powerpoint will update the figure in the document (maybe saving and reopening needed to see the changes hehehe). I find this feature great but can’t replicate it on Pages or Keynote.
Reporting tables
Method 1
First, a few functions that will help you format text that you might occasionally need to copy-paste between R and your favourite text editor.
base::format()orbase::prettyNum()to format numeric values with the exact number of decimals or scientific number formatting you want or big number separator as in 1,234,567.90
You can ask R to show up to 50 decimals, so here is pi!
base::formatC(pi, 50)
> 3.141592653589793115997963468544185161590576171875base::format()orstringr::str_pad()(tidyverse) to align text or add “0” strings before numbers to get 01, 02, …, 09, 10, 11broom::tidy()(tidyverse) will give you model results in a much more manageable format thanbase::summary(). See attached screenshot.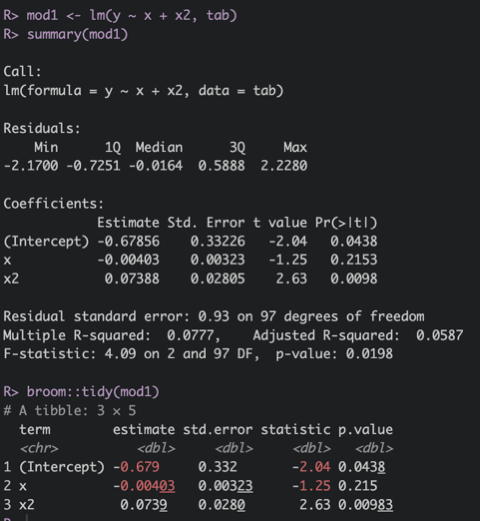
The glue package with its central function
glue()offers a smarter tidyverse alternative tobase::paste()
Method 2 AKA the reproducible method
The second method I recommend to users who copy-paste / type results in tables in their Powerpoint or Word documents: using R language to directly create the tables. I should keep it simple and present only one but I see a strong advantage in each of these two packages: flextable and gt.
The flextable package
It’s a highly customisable tool to turn a data.frame or matrix or tibble or data.table or other types of table-like objects in a fully formatted table with borders, justified text, merged cells for titles, legend and all. The functions have clear names and using a pipe, it would look like the code for a ggplot. I’ll only give an example and the associated result:
  library(flextable)

  ft <- flextable(airquality[ sample.int(10),])
  ft <- add_header_row(ft,
    colwidths = c(4, 2),
    values = c("Air quality", "Time")
  )
  ft <- theme_vanilla(ft)
  ft <- add_footer_lines(ft, "Daily air quality measurements in New York, May to September 1973.")
  ft <- color(ft, part = "footer", color = "#666666")
  ft <- set_caption(ft,
                    caption = "New York Air Quality Measurements")
  ft
And a screenshot of the corresponding table: 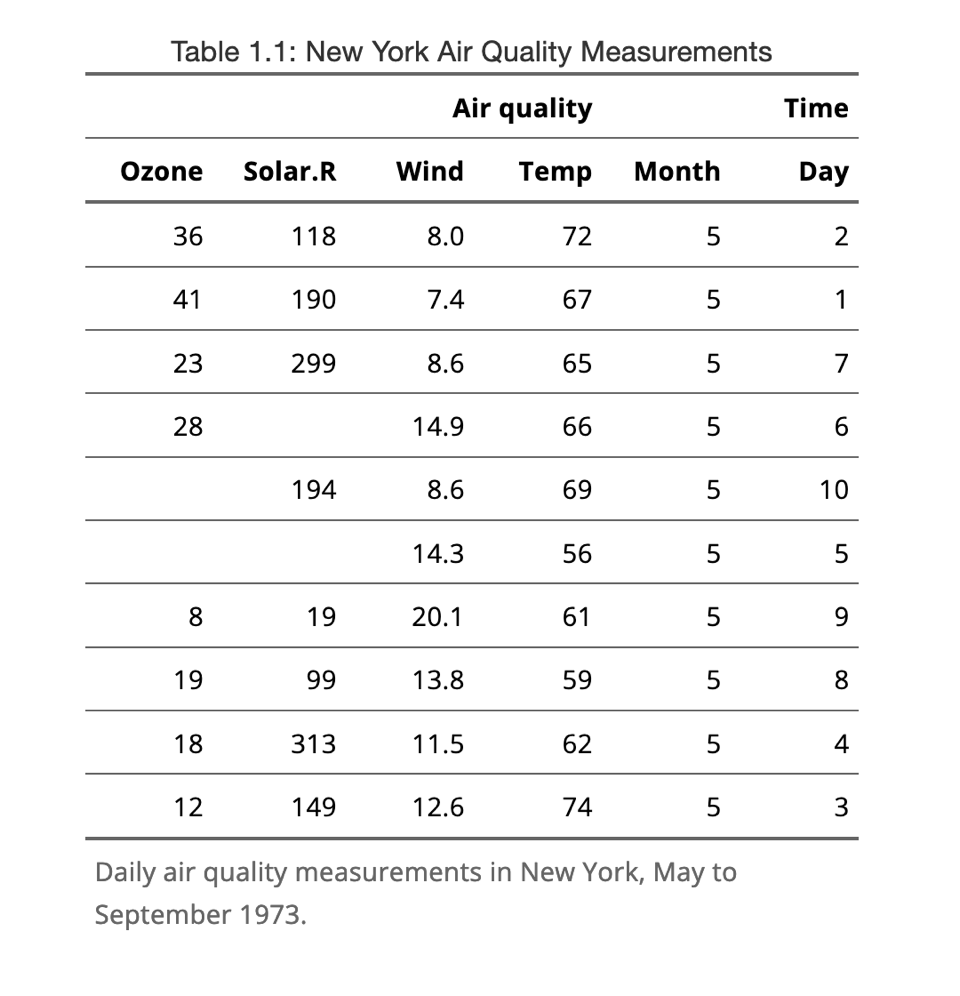
The gt package
The gt package is a Rstudio package and integrates naturally with tidyverse. It also profits from a large community of users and a small universe of extensions such as gtsummary and gtExtras. The gt creators provide a video describing some of the features and functions:
Here is an example they provide with code integrated with dplyr functions:
  library(gt)
  # Define the start and end dates for the data range
  start_date <- "2010-06-07"
  end_date <- "2010-06-14"

  # Create a gt table based on preprocessed
  # `sp500` table data
  sp500 |>
    dplyr::filter(date >= start_date & date <= end_date) |>
    dplyr::select(-adj_close) |>
    gt() |>
    tab_header(
      title = "S&P 500",
      subtitle = glue::glue("{start_date} to {end_date}")
    ) |>
    fmt_currency() |>
    fmt_date(columns = date, date_style = "wd_m_day_year") |>
    fmt_number(columns = volume, suffixing = TRUE)
This code directly produces this table: 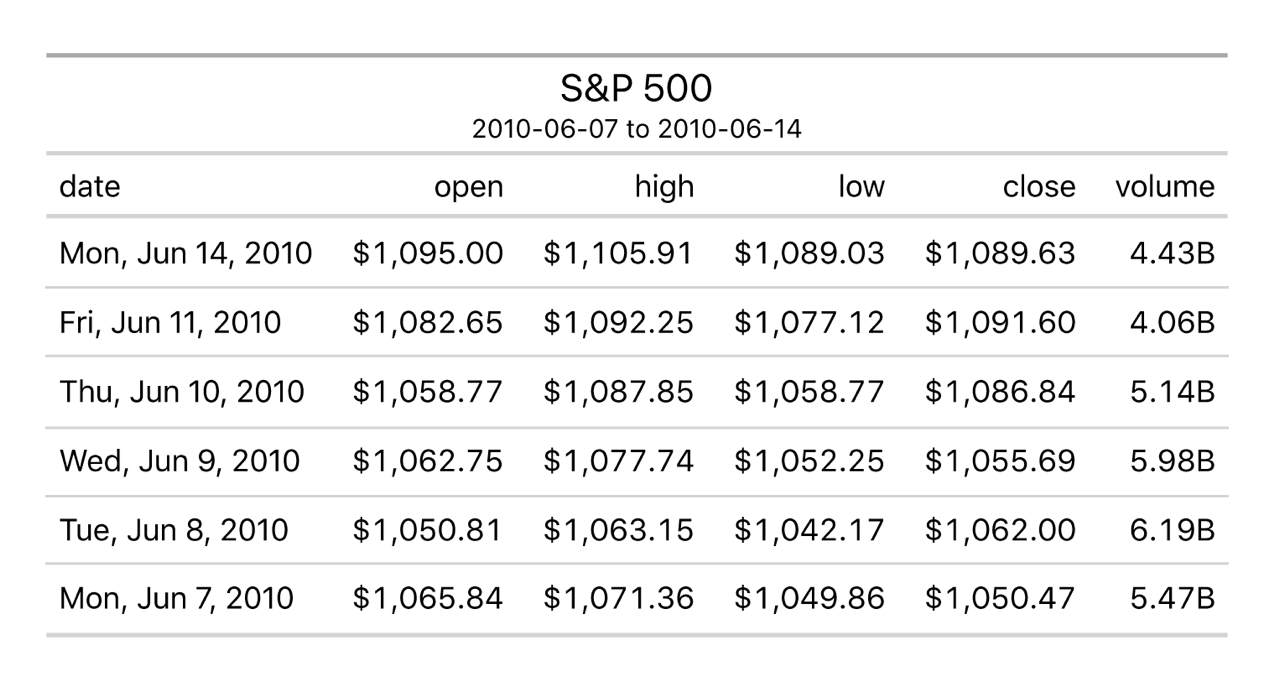
Now the workflow part!
In both cases you’ll begin in your script, maybe have a dedicated script that produces figures and another one for tables, using gt or flextable to create formatted tables. Then I see different ways:
- For Powerpoint. You save your tables as images.
flextableonly, points for flextable! You then directly include the table in your presentation using the ‘Insert with link’ option I described in the sectionReporting figures.
save_as_image(ft, path = "/path/to/file.png")- Zero (0) manipulations to do once the script is written…
- For Word.
You’re fine having all of your tables seating in a separate docx document. flextable for the win again:
save_as_docx("my table 1" = ft1, "my table 2" = ft2, path = "/path/to/file.docx")- Zero (0) manipulations to do once the script is written…
You want the table in your manuscript, exactly where it is useful (if Words let you ;) ). Then it seems that you’ll have to copy paste into your own document from the viewer in Rstudio or from the produced Word, Powerpoint or pdf document you produced.
- For both Powerpoint and Word, you can use functions from the
officerpackage to add slides or pages to your documents and include your tables there. Crazy but I see this as an option only when nothing will change in your results anymore and it seems to me that there is always a last last change to make… But a direction to explore still, withflextable.
Conclusion
In any case, all these workflows save you from typing (highly error-prone) any result. The next step I see would be a single markdown scripts with code for all your figures and tables reliably and reproducibly saving a single docx or pdf document.
In the end, flextable also has a little universe of complementary packages and great functions and won the game…
I hope you learned something new or thought about making your workflow more streamlined and reproducible. Happy to hear about what you think about the topic, the packages presented or anything I missed, and to collaborate with you trying to set these in your workflow.
Best wishes,
Alban